METHOD
To create the spreadsheet, I did the following:
FORMULAE USED:
To create the spreadsheet, I did the following:
- I collected relevant data from the various websites. Some of the websites allowed me to copy the data directly into excel. But, I had to manually enter some of the data.
- I arranged all the data in the worksheet 'DATA'. In order to make the data look more presentable, I inserted tables of different colors and center-aligned all the data.
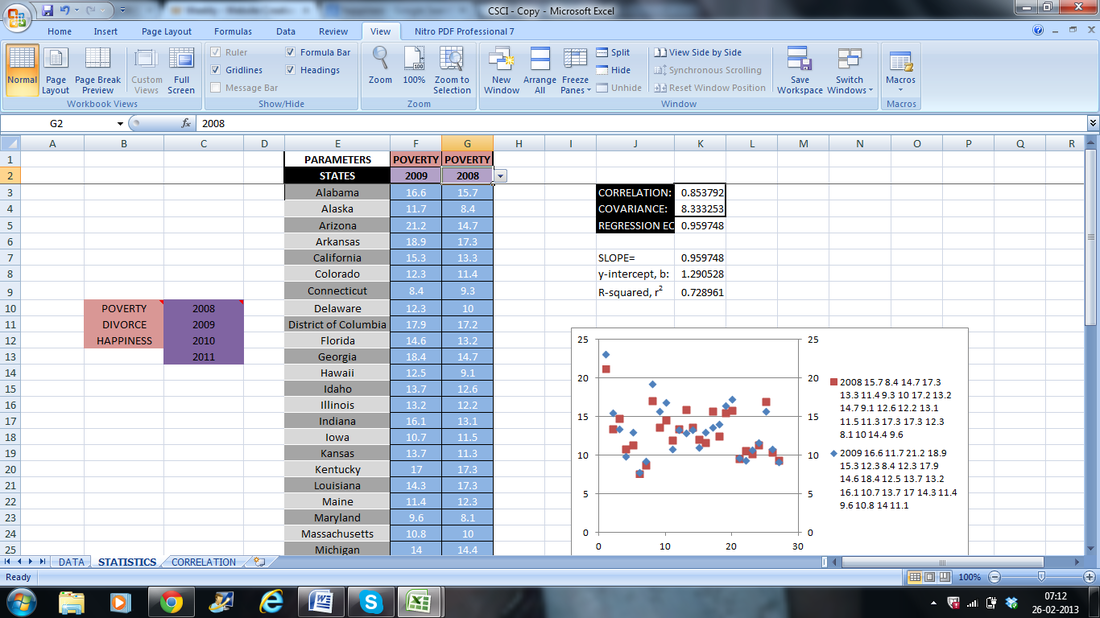
- I wanted to have a worksheet which would show me the value of the parameter for all the states for a particular year. In the sheet 'STATISTICS", I made four drop-boxes. When I click on cell F1, a drop-down box appears and I can choose from Poverty, Divorce and Happiness. Below F1, when I click on cell F2, another drop-down box appears and I can choose a year. This displays the values for all the states starting from cell F3.
- The Line graph in the sheet 'STATISTICS' shows the graphical relationship between the two chosen parameters and gets updated when a different parameter is chosen. It also shows the linear regression equation and the value of R2.
- Correlation and Covariance for the data have also been calculated in cells J3 and J4 of the sheet 'STATISTICS'. These get updated automatically when the parameters are changed.
- The worksheet 'CORRELATION' shows the correlation coefficient between all the possible parameters using the CORREL formula.
FORMULAE USED:
- 'Freeze Panes' to freeze the top row of the table in 'DATA' and 'STATISTICS'.
- Used Data Validation to create the numerous drop-down boxes.
- 'Index' and 'Match' functions to find out the value of the particular parameters for the chosen states.
- 'Correl' and 'Covar' to find correlation and covariance respectively.
